
Where I continue to discus how to debug code on the ATtiny13A on a Linux computer using the Microchip Snap, bloom, avr-gdb and gdb-dashboard. This entry goes into a detail as to how I like to use avr-gdb, Bloom and a customized window from gdb-dashboard to debug the ATtiny13A.
Sources#
The code for this article and other articles on the ATtiny13A can be found in the ATtiny13A repository. Additional detail and files for implementing this aproach can be found ATtiny/docs/gdb_dashboard.
Introduction#
While the TUI approach works well, and I’ve used it quite a bit, this new solution provides greater detail when running a program. It provides the ability to specify specific registers and I/O on a per program basis. This capability is valuable when you want to debug a particular aspect of the ATtiny13A.
Example#
This is the full window of a very simple example. In this case, the full window is overkill, as the program is an assembly language blink program. It does show how this approach can be valuable. The bug is that the LED is not blinking, even though one can see the LED toggle command in the Source window (1). And the specific output pin (PORTB0) is set as its shown uppercase and green (2). The bug is that ddb0 is gray and lowercase, this means it is 0 as in the pin is configured as an input (3). You can also see this in the value of PORTB.DDRB is 0x00. This pin must be set (uppercase/green) for the pin to be configured as an output, thus lighting the LED.
Note: PINB5 is also set. This is an artifact of the pin also serving as the debugWire connection.
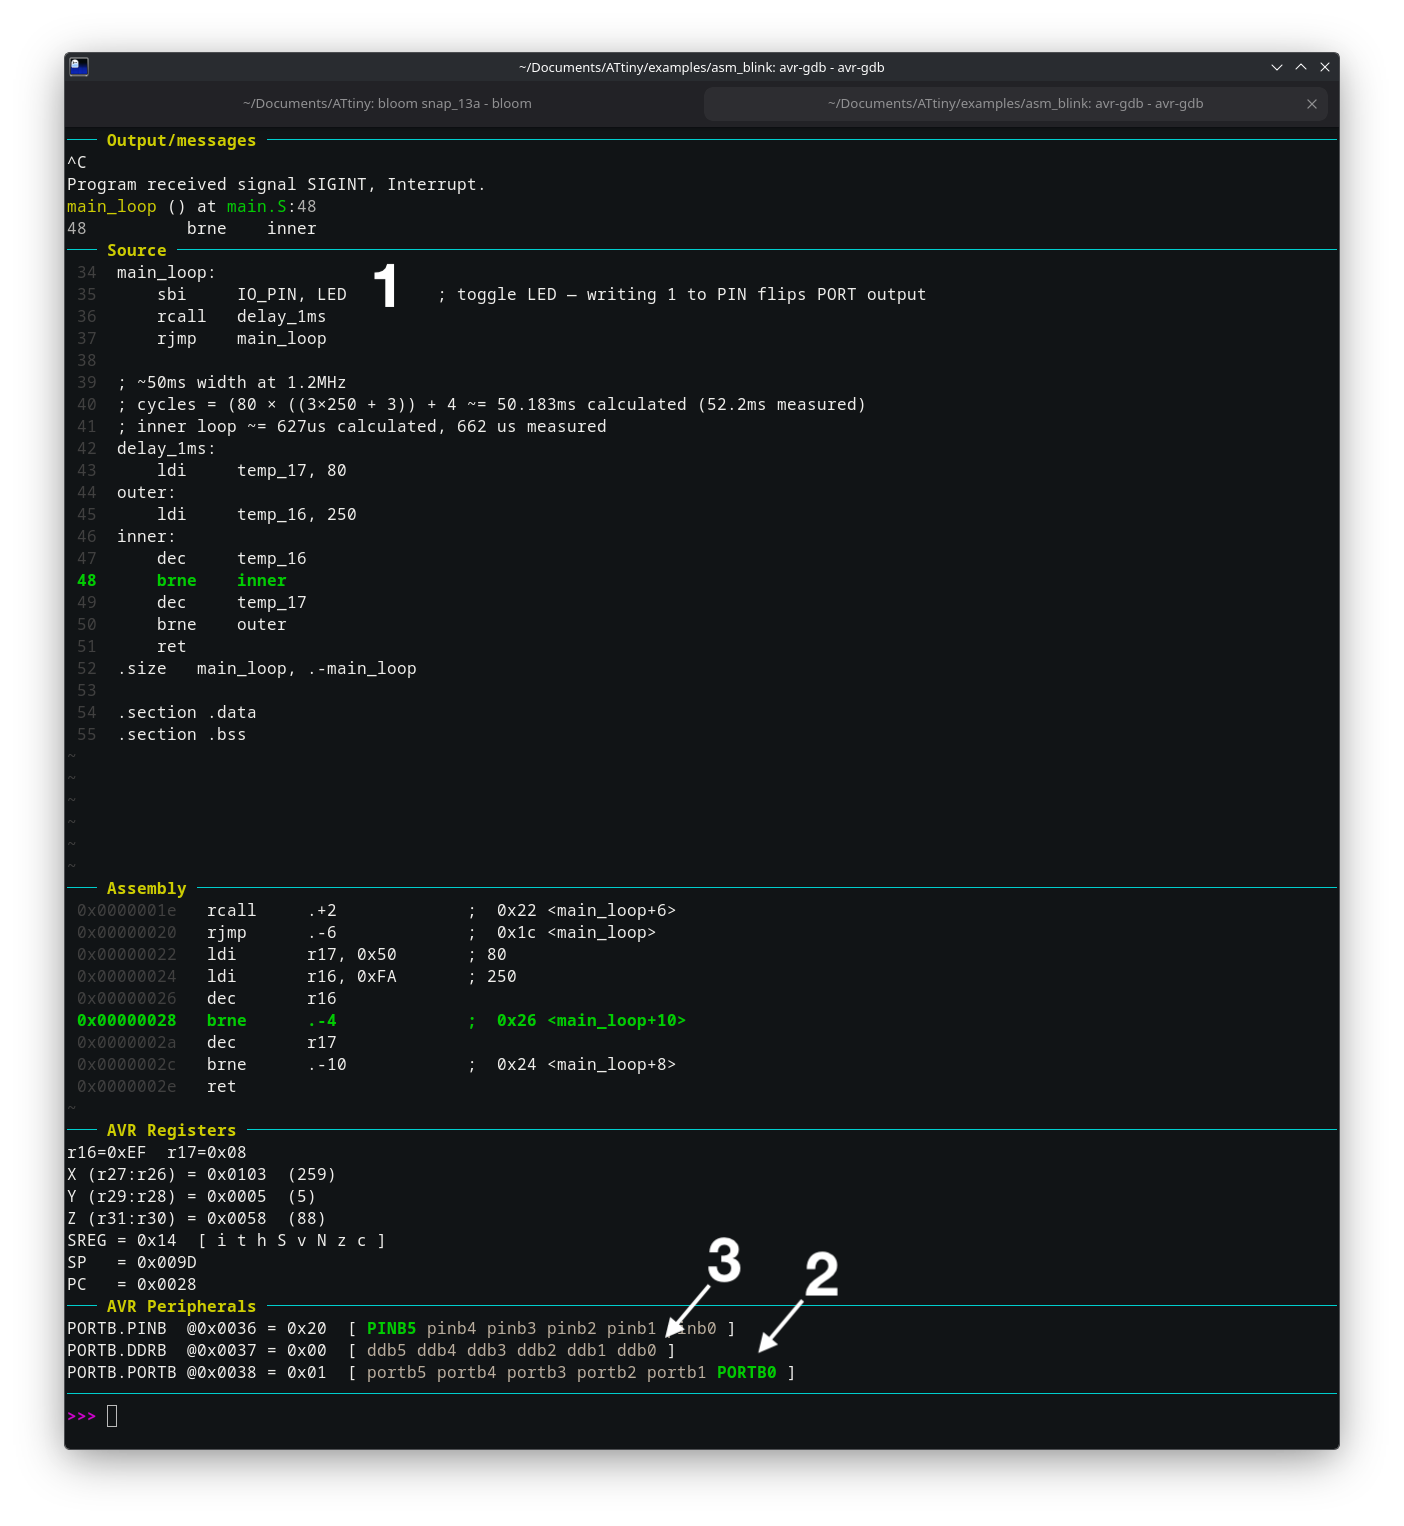
Simple gdb-dashboard example
Customization#
Viewing a complete simulator-type window makes debugging programs easier. This solution provides the following customization:
- Adjust the size of the source window height. Sometimes, the source isn’t important as the values in registers and memory. Setting the source down to 5 lines, opens up more space for the registers and memory.
- Specify and name locations in memory. Performing a
avr-objdump -t main.elf, will list all of the variables and their addresses in memory. Very handy for watching buffer values. - As shown in the example above, display register bit values. By having the bits shown as set/not set, it makes it very easy to determine if an action has been performed (such as setting a pin as an output).
- Display register values. In the example, asm_blink_nodelay, Timer 0 is used to blink the LED. By showing all of the registers of Timer 0, it is easy to see if the Timer has been configured correctly. (See image below.)
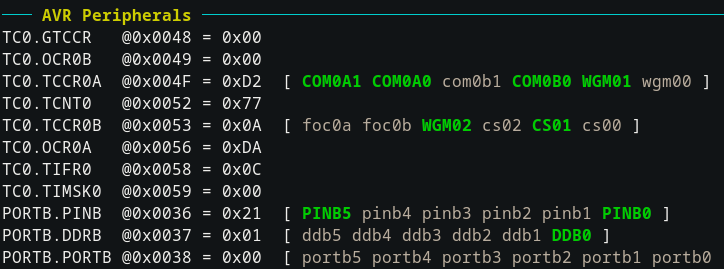
Timer 0 example
Installation#
Note: This installation requires bloom as the gdb-server.
Also in repository ATtin13A/docs/gdb_dashboard
- Install gdb-dashboard as
~/.gdbinit:(Requires awget -P ~ https://github.com/cyrus-and/gdb-dashboard/raw/master/.gdbinitgdb/avr-gdbbuilt with Python support — the standard toolchain has it.) - Copy the AVR files:
mkdir -p ~/.gdbinit.d
cp docs/dashboard/avr_modules.py   ~/.gdbinit.d/
cp docs/dashboard/avr_layout.gdb   ~/.gdbinit.d/
cp docs/dashboard/avr_connect.gdb  ~/.gdbinit.d/
cp docs/dashboard/avr_commands.gdb ~/.gdbinit.d/
cp docs/dashboard/avr_autostart.py ~/.gdbinit.d/
cp docs/dashboard/avr_settings.gdb ~/.gdbinit.d/
cp docs/dashboard/gdbearlyinit     ~/.gdbearlyinit
~/.gdbinit.d/ is auto-sourced by gdb-dashboard: .py files load as Python
modules, everything else are GDB scripts.
- Create a bloom.yaml file specifically for the ATtiny13A:
environments:
  atmel_ice_13a:
    shutdown_post_debug_session: true

    tool:
      name: "atmel_ice"

    target:
      name: "attiny13a"
      physical_interface: "debug_wire"
      hardware_breakpoints: true
      manage_dwen_fuse_bit: true

    server:
      name: "avr_gdb_rsp"
      ip_address: "127.0.0.1"
      port: 1442

  snap_13a:
    shutdown_post_debug_session: true

    tool:
      name: "snap"

    target:
      name: "attiny13a"
      physical_interface: "debug_wire"
      hardware_breakpoints: true
      manage_dwen_fuse_bit: true

    server:
      name: "avr_gdb_rsp"
      ip_address: "127.0.0.1"
      port: 1442

    insight:
activate_on_startup: falseUsage#
Two terminal windows, one for bloom and the other for avr-gdb:
# terminal 1 -- the GDB server
cd ATtiny/
bloom snap_13a
# terminal 2 -- the debugger (no banner, auto-connects, clean dashboard)
cd ATtiny/examples/blink_asm
make complete
avr-gdb
(gdb) c # to begin execution
(gdb) # once running; Ctrl-C to halt (or to set a breakpoint etc)
(gdb) q # q to quit avr-gdbconnect— re-run the attach/flash/redisplay by hand if needed.cll— rebuild (make), reload onto the target, and list source.mrc— reset to the 0000 vector and run (mon reset+continue).mon reset— reset the core to the 0000 vector.dashboard -layout source assembly avrregs— change which panes show.dashboard avrregs— toggle a pane.
If errors#
Like all programs, one can introduce formatting or logical bugs in the configuration file, avr_dashboard.py. The .gdbinit program might cover up the bugs with a new screen, making it difficult to ascertain and solve the problem. When this happens:
avr-gdb > test.txtThis will write the contents of the first two screens to the file test.txt, and examing this file can help you find the error. To reclaim the terminal, Ctrl-C to stop avr-grb and q to quit.
Another solution, in program is to enter dashboard -output ./dashboard.log at a gdb prompt. This will log all of the content to a file for review. This won’t work on problems which occur at the initial start.