Where I compare the Labrador with the $300 Digilent Analog Discovery 2 and determine if using a “rail-to-rail” operational amplifier matters.
Sources#
- LM358 Datasheet
- OP484 Datasheet
- Analog Devices Op Amp Inputs, Outputs, Single-Supply, and Rail-to-Rail Issues
- Texas Instruments A Single-Supply Op-Amp Circuit Collection
Research#
This video, Rail to Rail Op Amps P1 got me thinking as to the issues with the LM358. So to determine if it mattered on my previous amplifier design, I went back and redid the circuit. I used the OP484, as it was an op-amp I had and it is specifically a “Precision Rail-to-Rail Input and Output…”. I thought it would be interesting to do two things:
- Compare the Labrador vs a similar, however more costly USB scope the Digilent Analog Discovery 2
- Test the design with both the LM358, a low-cost op-amp that doesn’t go rail-to-rail vs. OP484, a rail-to-rail operational amplifier.
Compare Labrador vs. Analog Discovery 2#
Circuit#
My first step was to create a circuit using the OP484 online using CircuitLab. Doing this provided me with the specific signal response I would expect to see using either device. The values indicated are measured, not nominal.
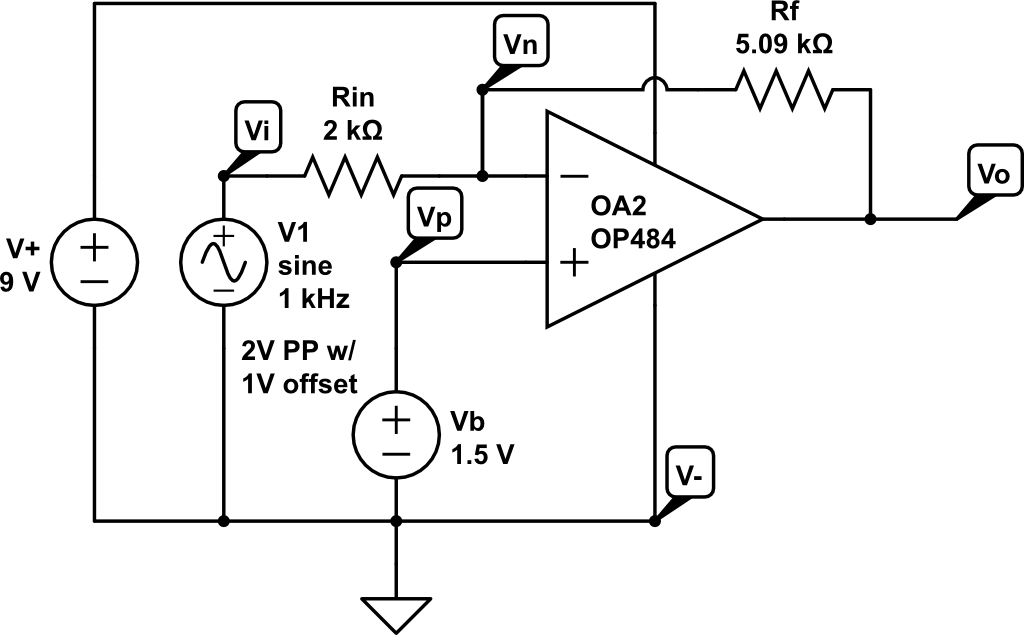
OP484-based inverting amplifier w/ single supply and 1.5V bias
Time Domain response#
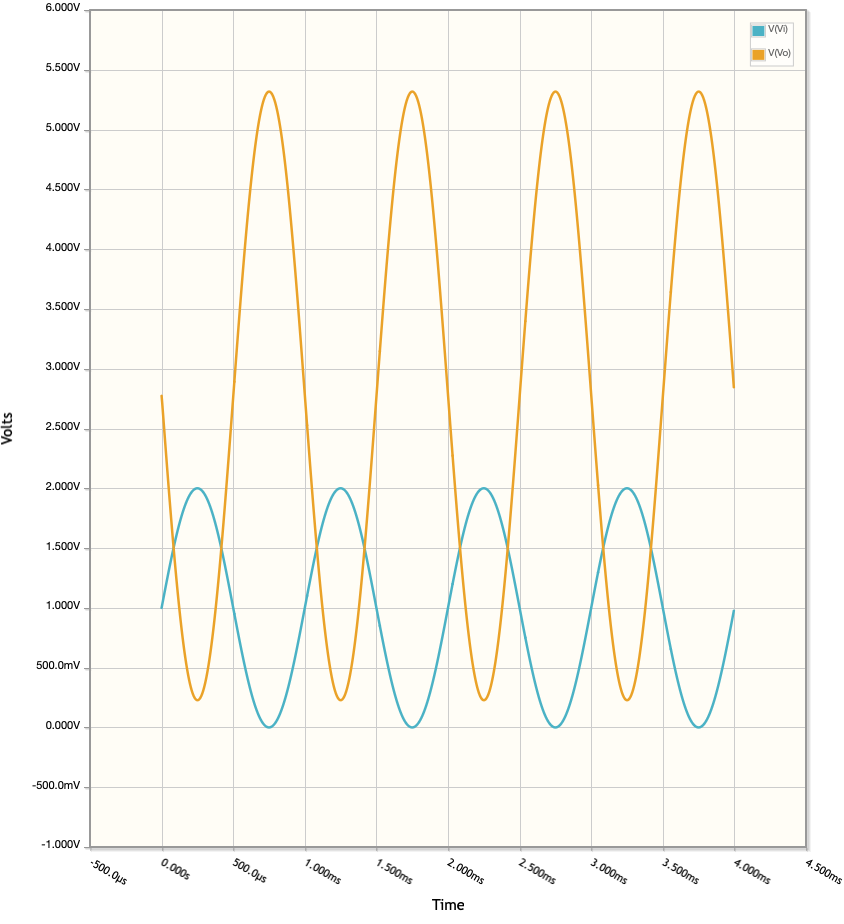
CircuitLab OP484-based inverting amplifier Time Domain Response
Waveforms Time Domain Response using the Analog Discovery 2#
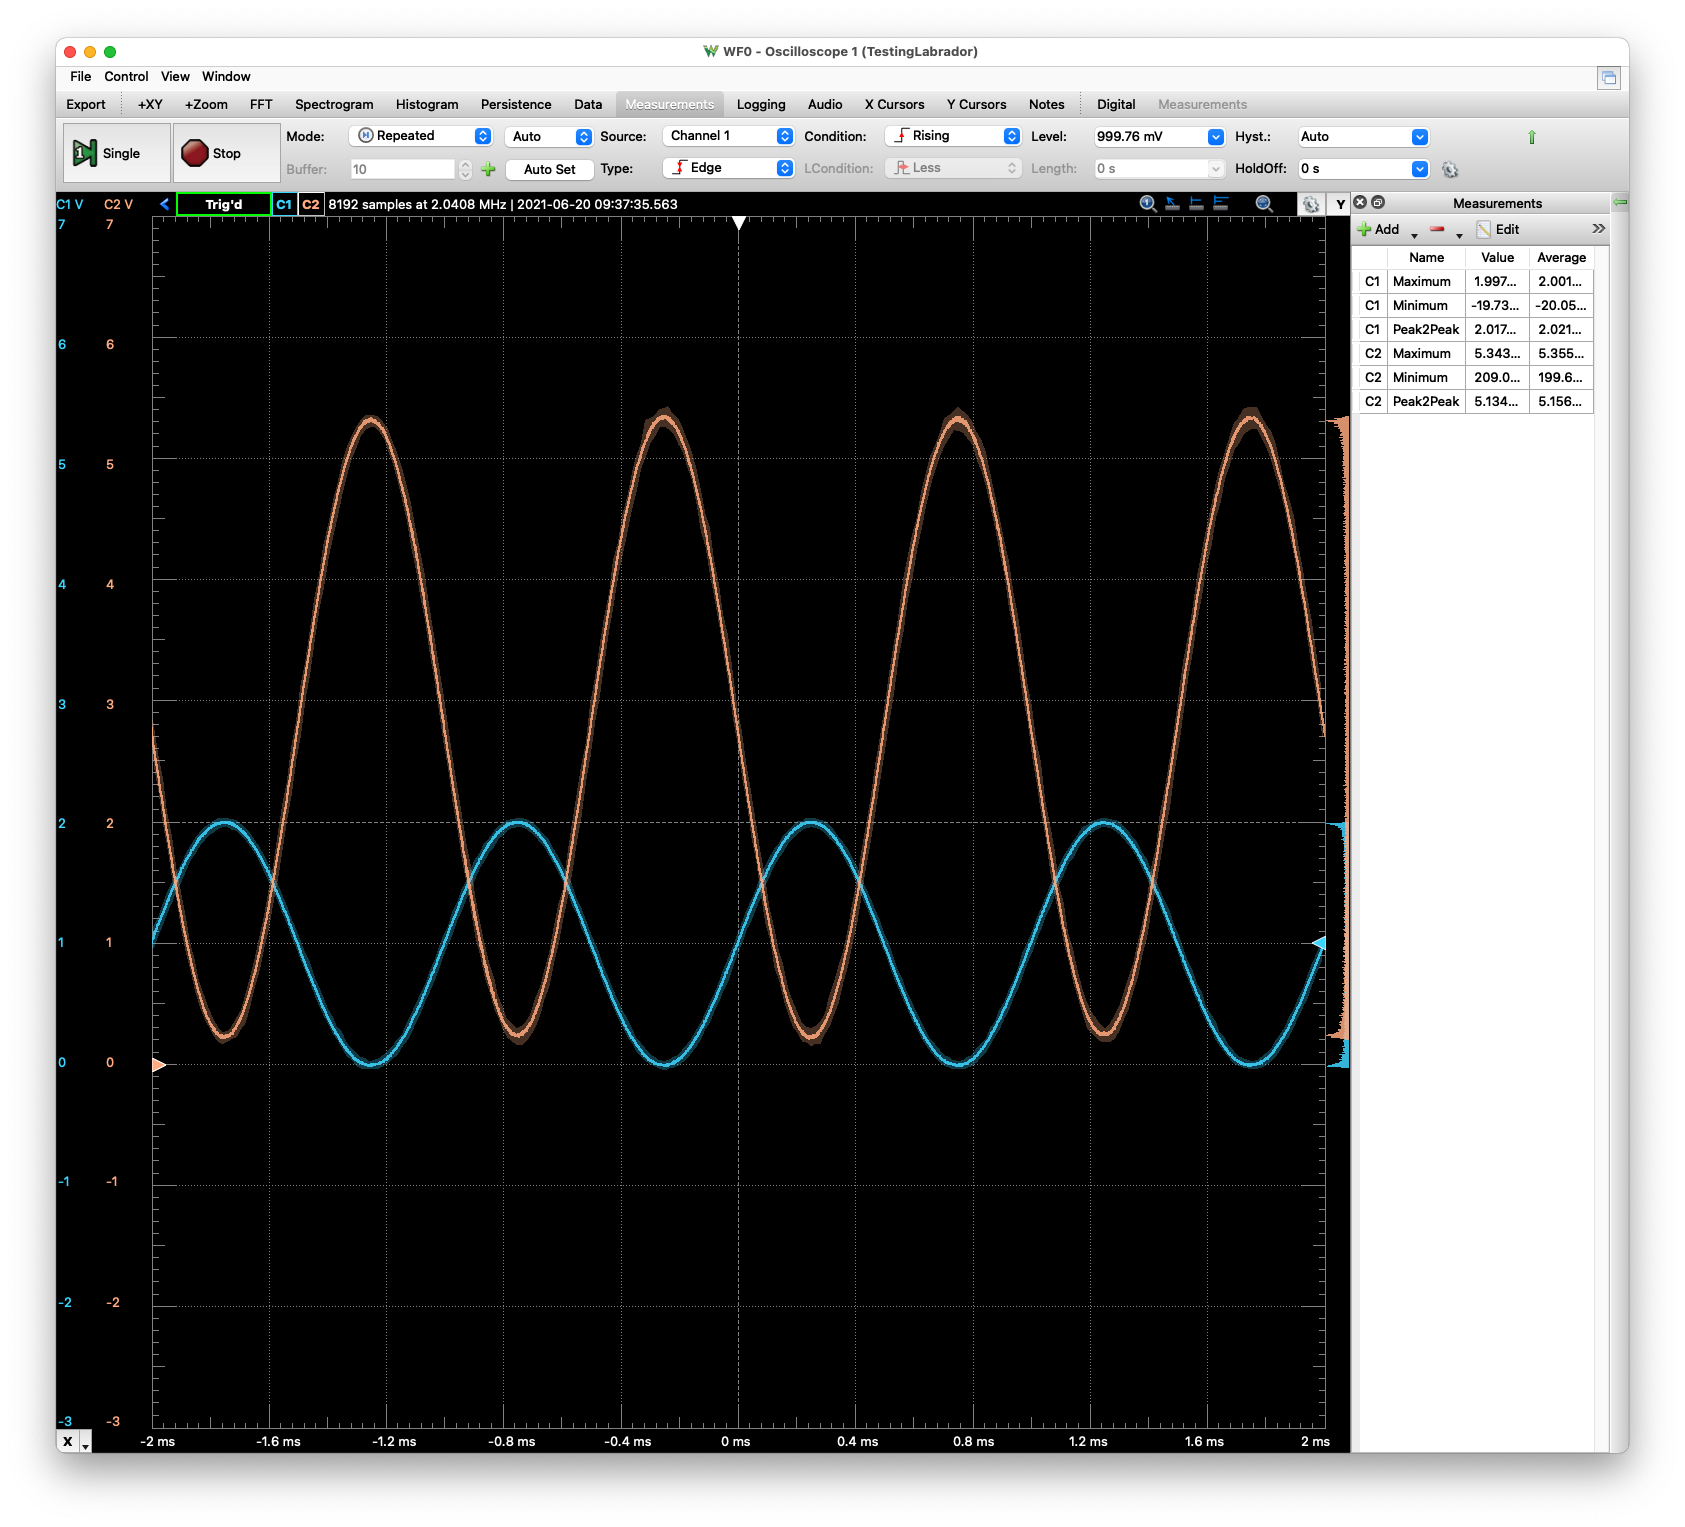
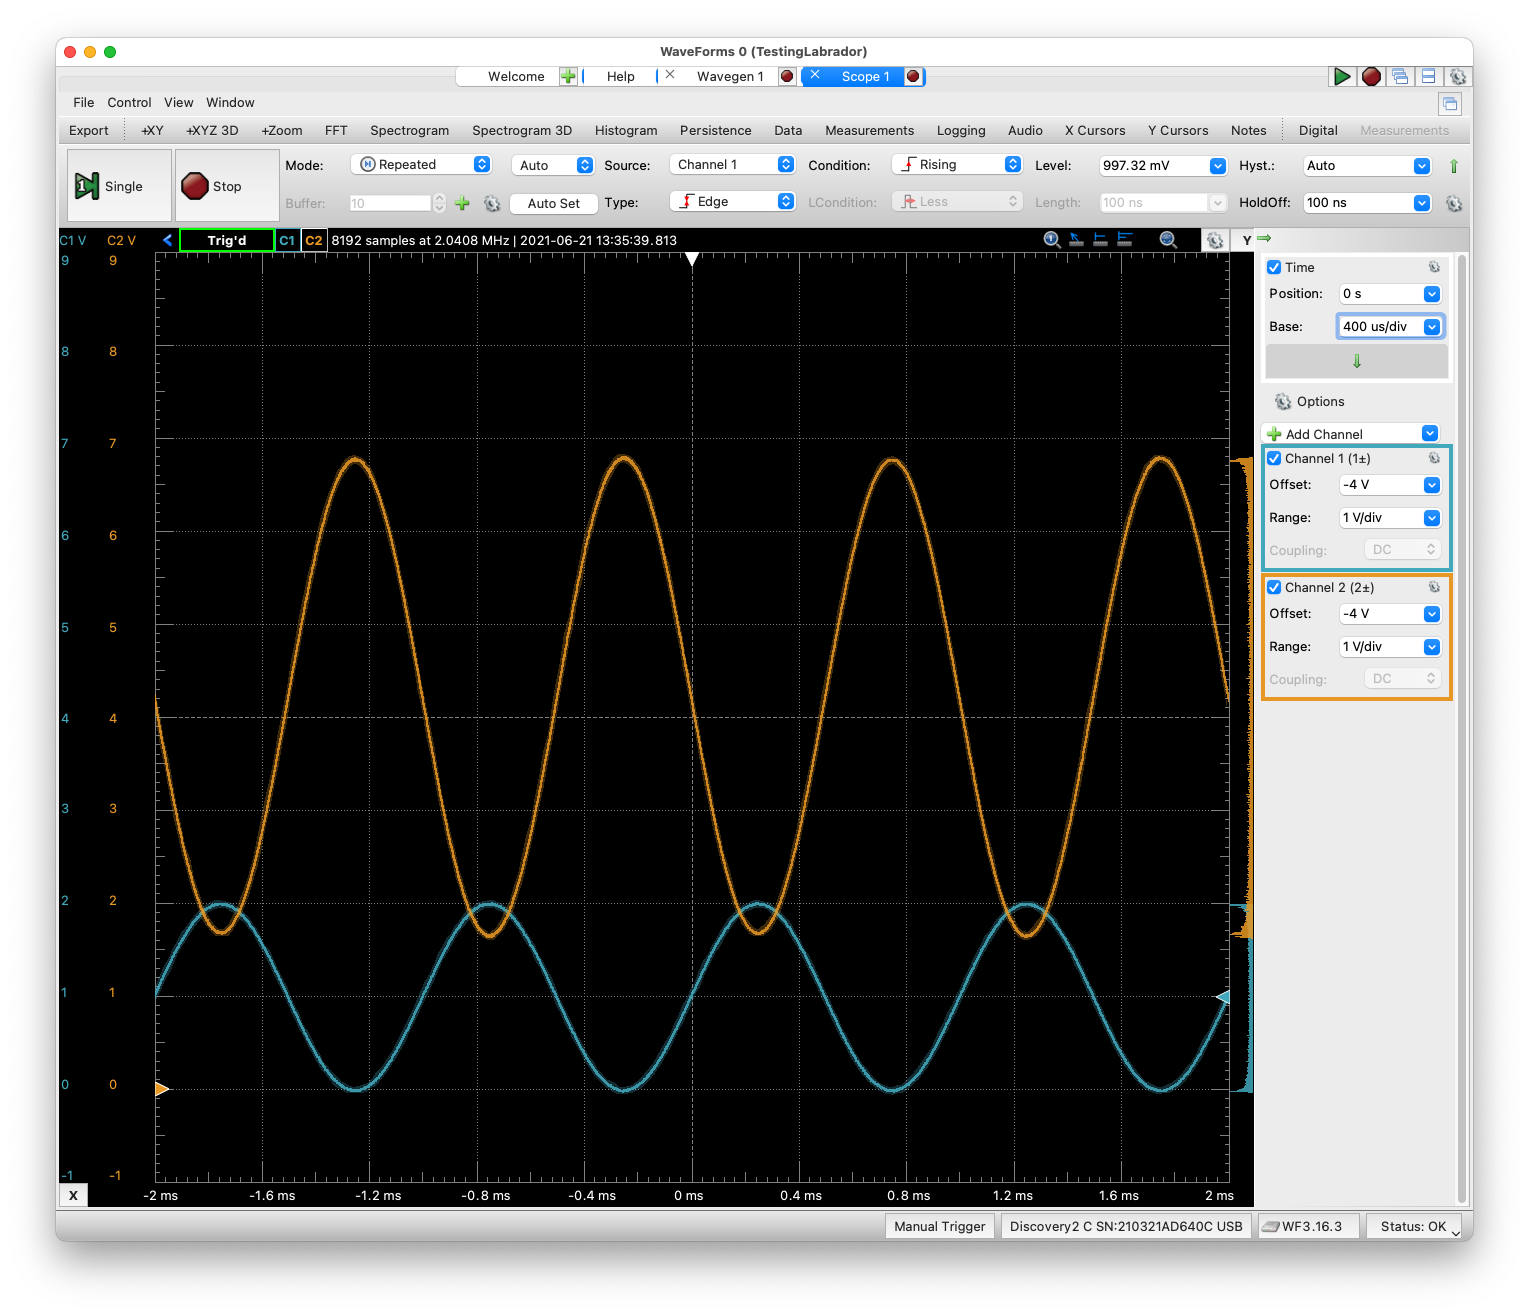
OP484-based inverting amplifier Time Domain Response measured using Waveforms/AD2
Labrador Time Domain Response#
I unplugged the AD2 and plugged in the Labrador. I already had connections from the Labrador to the locations on the breadboard, in this case, I was unplugging the USB on the AD2 and plugging the USB into the Labrador.
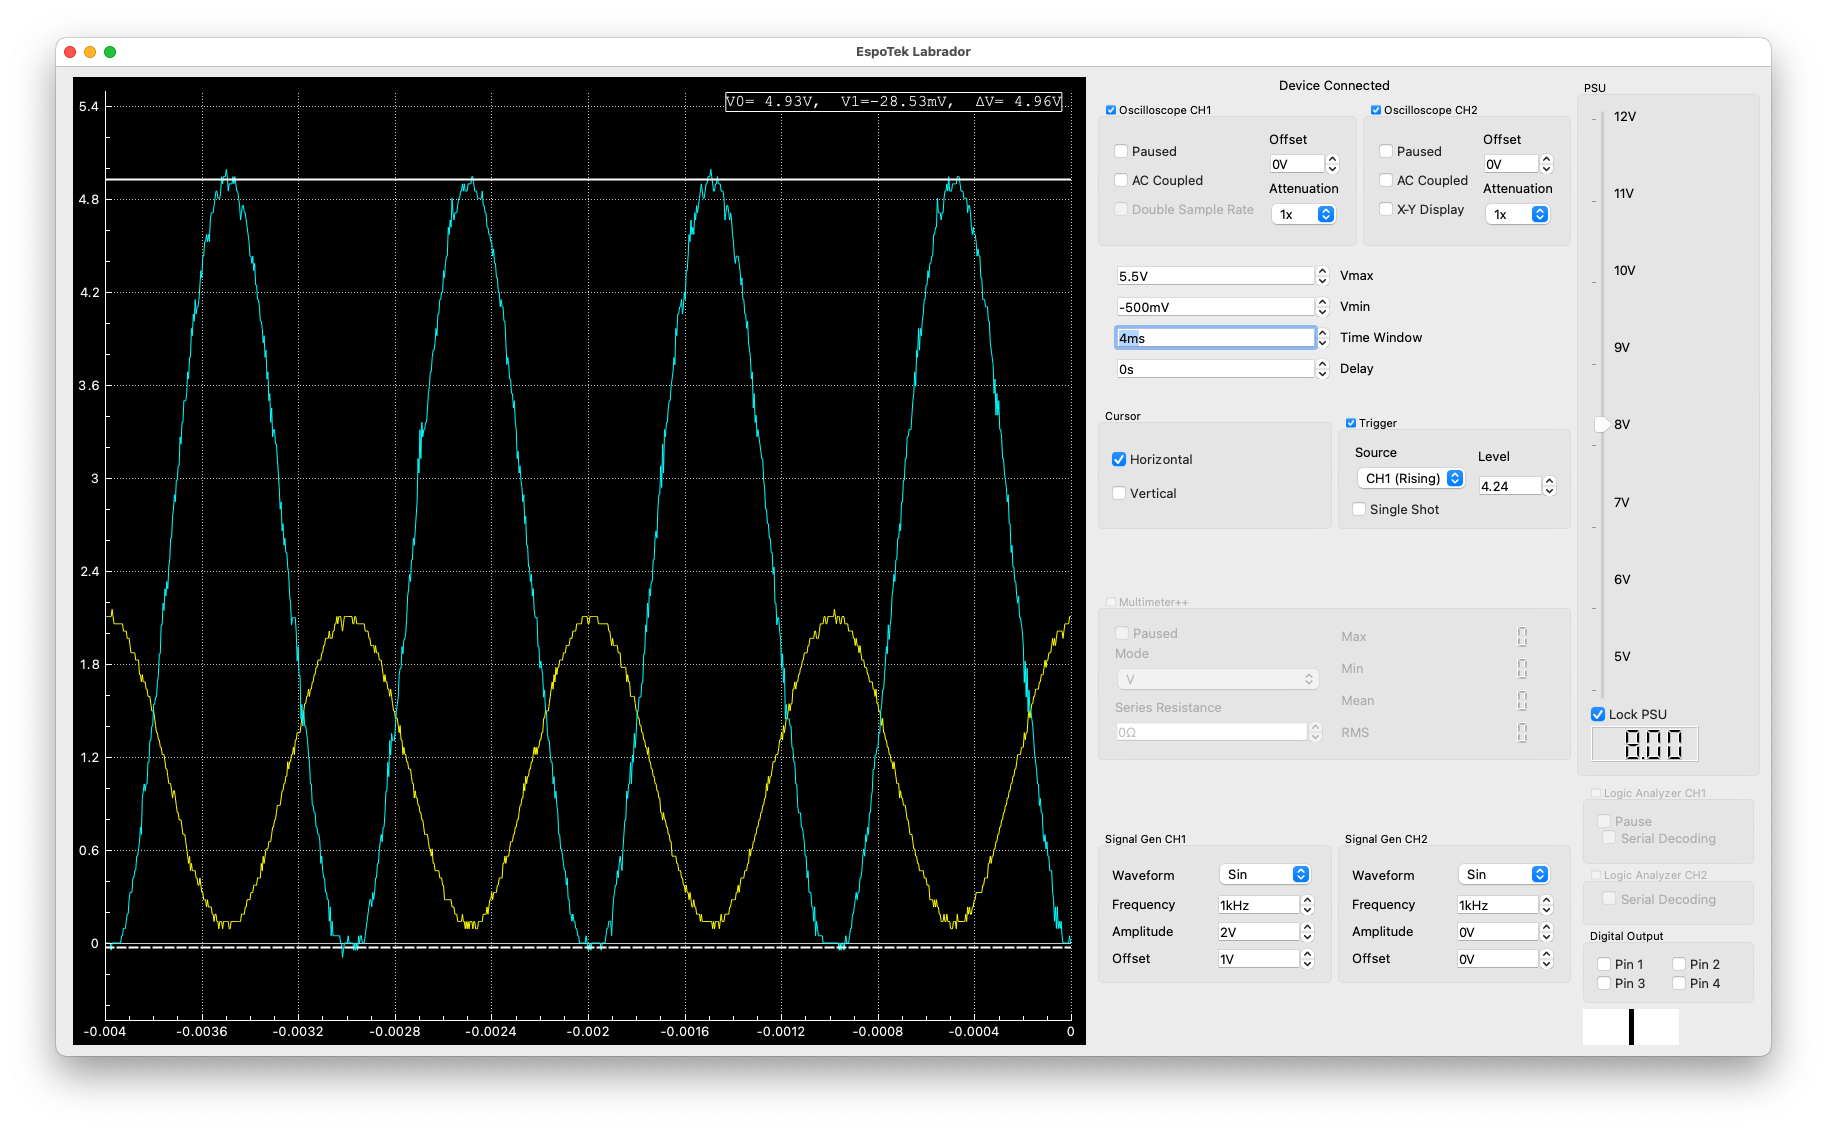
OP484-based inverting amplifier Time Domain Response measured using the Labrador
Results#
| CircuitLab | Value | Waveforms | Value | Labrador | Value |
|---|---|---|---|---|---|
| CH1 Max | 2.00V | CH1 Max | 2.00V | CH1 Max | 2.10V |
| CH1 Min | 0.00V | CH1 Min | -0.19V | CH1 Min | 0.13V |
| CH2 Max | 5.32V | CH2 Max | 5.36V | CH2 Max | 4.93V |
| CH2 Min | 0.23V | CH2 Min | 0.20V | CH2 Min | -0.29V |
Clearly the AD2 is a bit more accurate than the Labrador, as one would expect from a device costing 10X.
I view the cost difference a reflection of the increased capability of the AD2. For example, the Waveforms software which controls the AD2, is far more comprehensive and user-friendly than that of the Labrador. The feature set of the AD2 is much greater than the Labrador.
Is the AD2 10X the value of the Labrador, absolutely! However, for someone new to electronics and either due to desire or ability, is only able to spend $30 for a piece of test equipment, the Labrador is phenomenal.
Compare LM358 vs. OP484 Rail to Rail#
As to the question at the start, does rail-to-rail operational amplifier matter? I’ll let this image of the LM358 in an identical setup as above provide the answer.
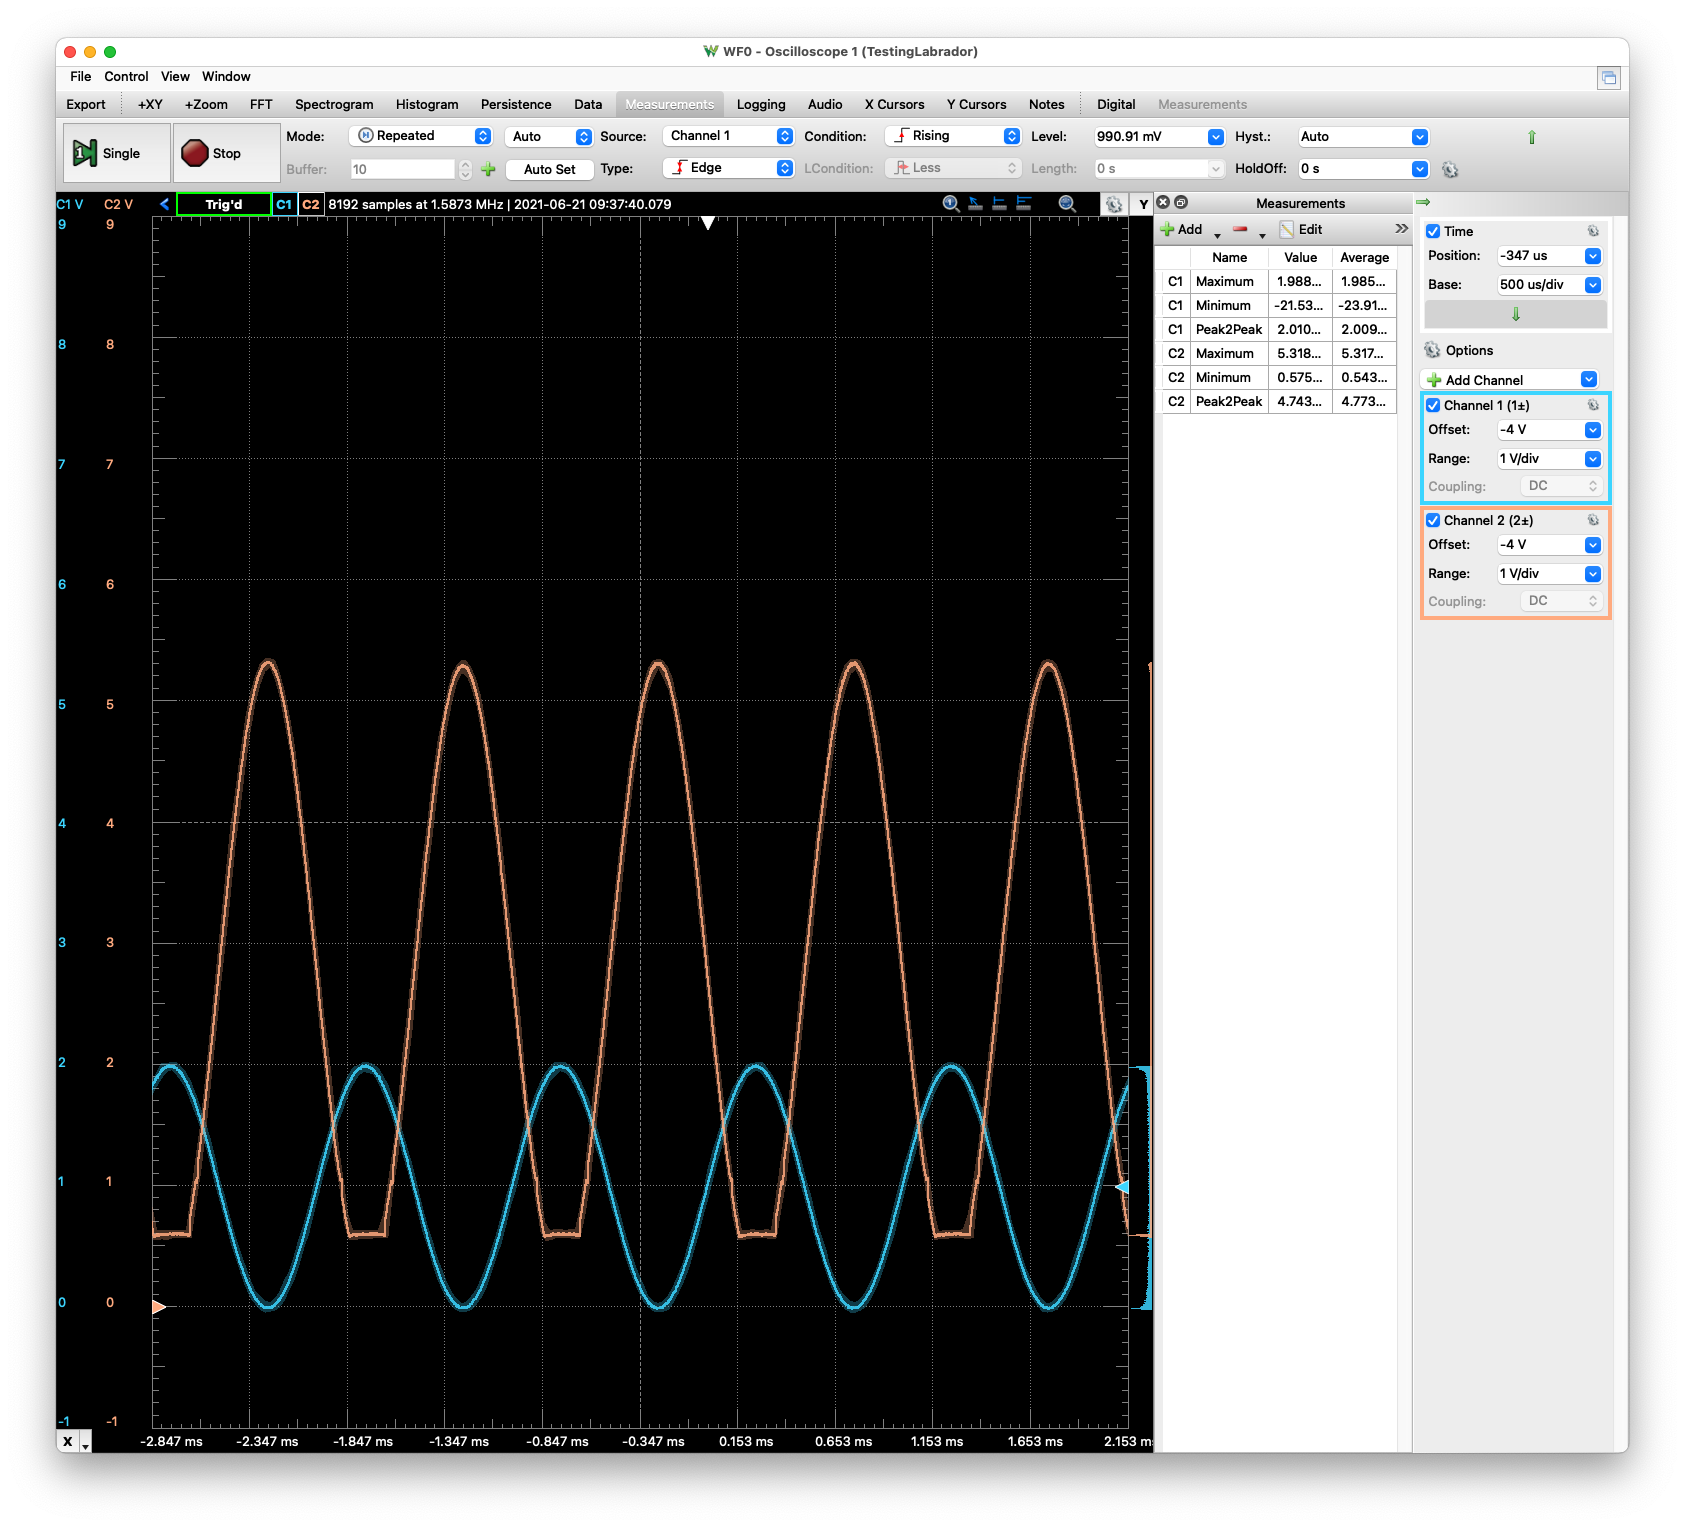
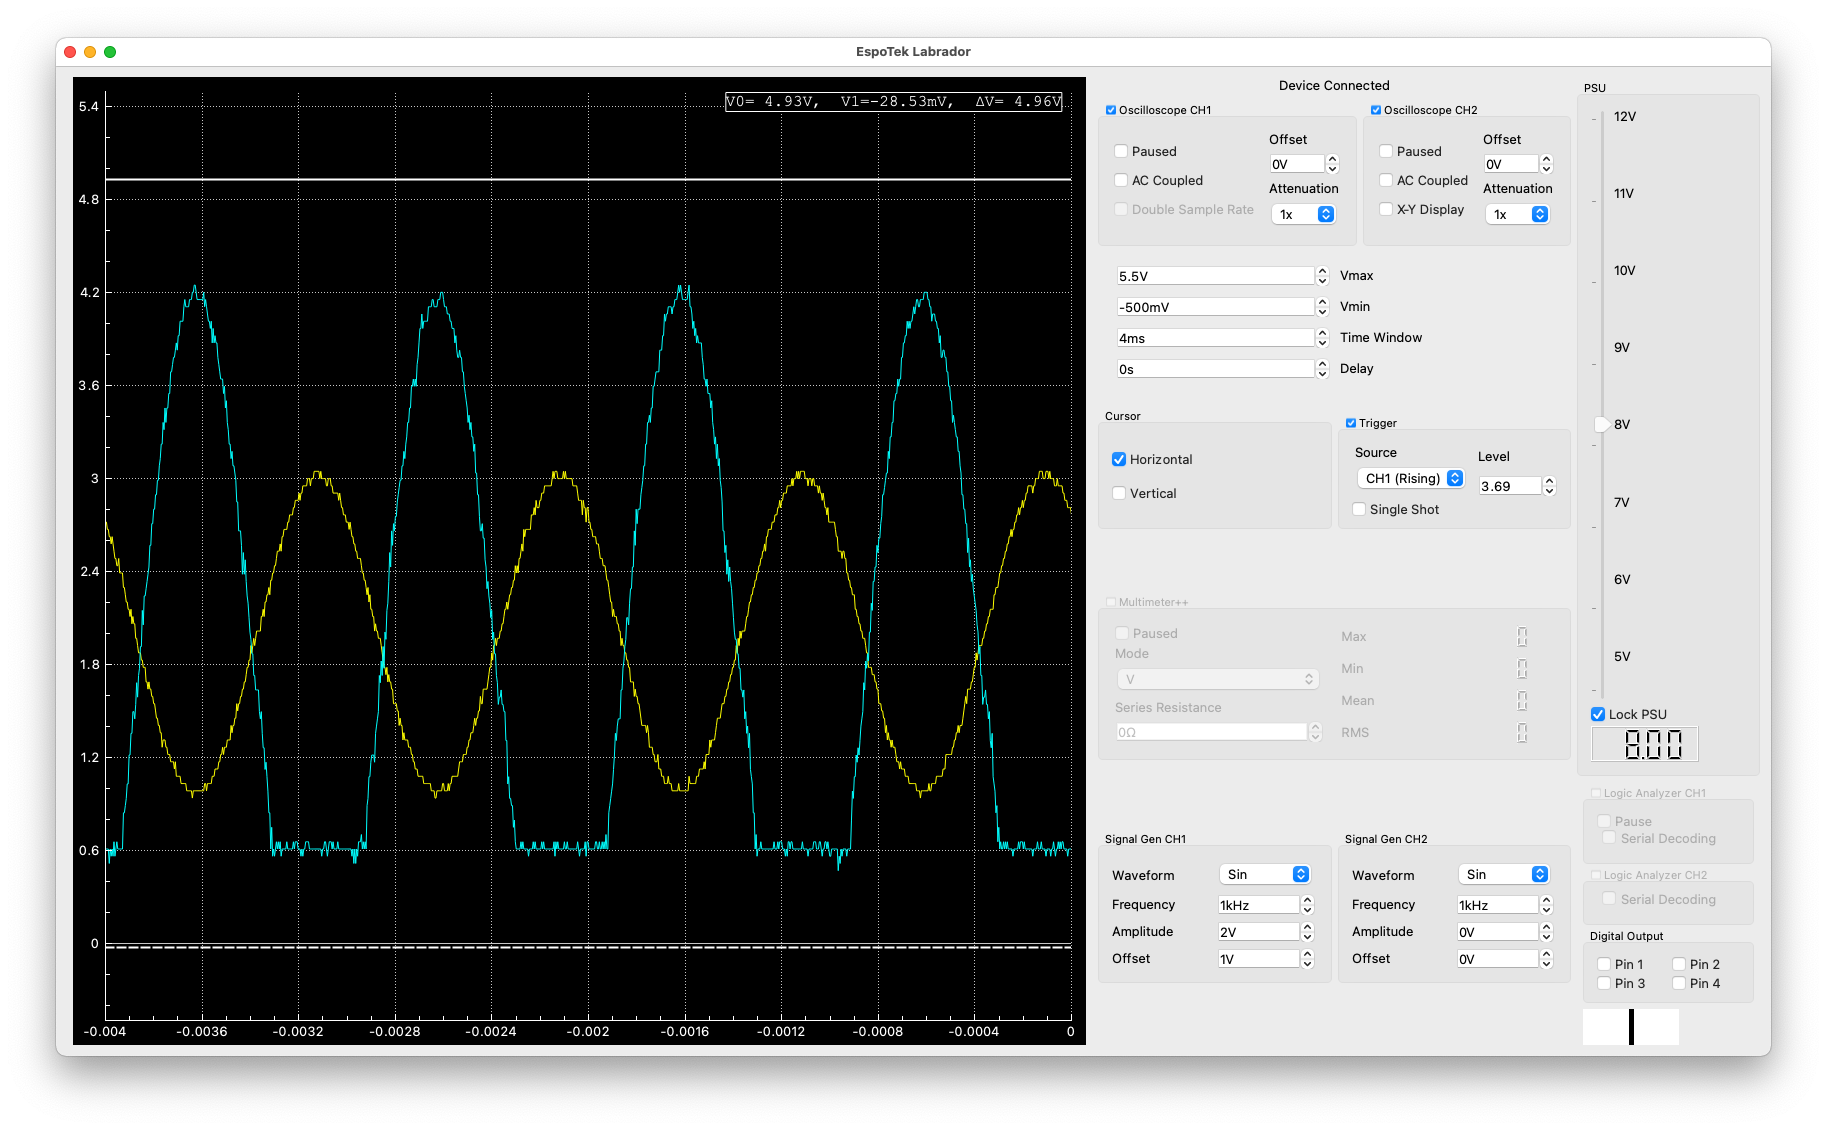
LM358-based inverting amplifier Time Domain Response measured using the Waveforms/AD2
Notice the clipping which is happening on the bottom of the output wave. One way to fix this is to dial-up the bias voltage such that the output signal sits higher…
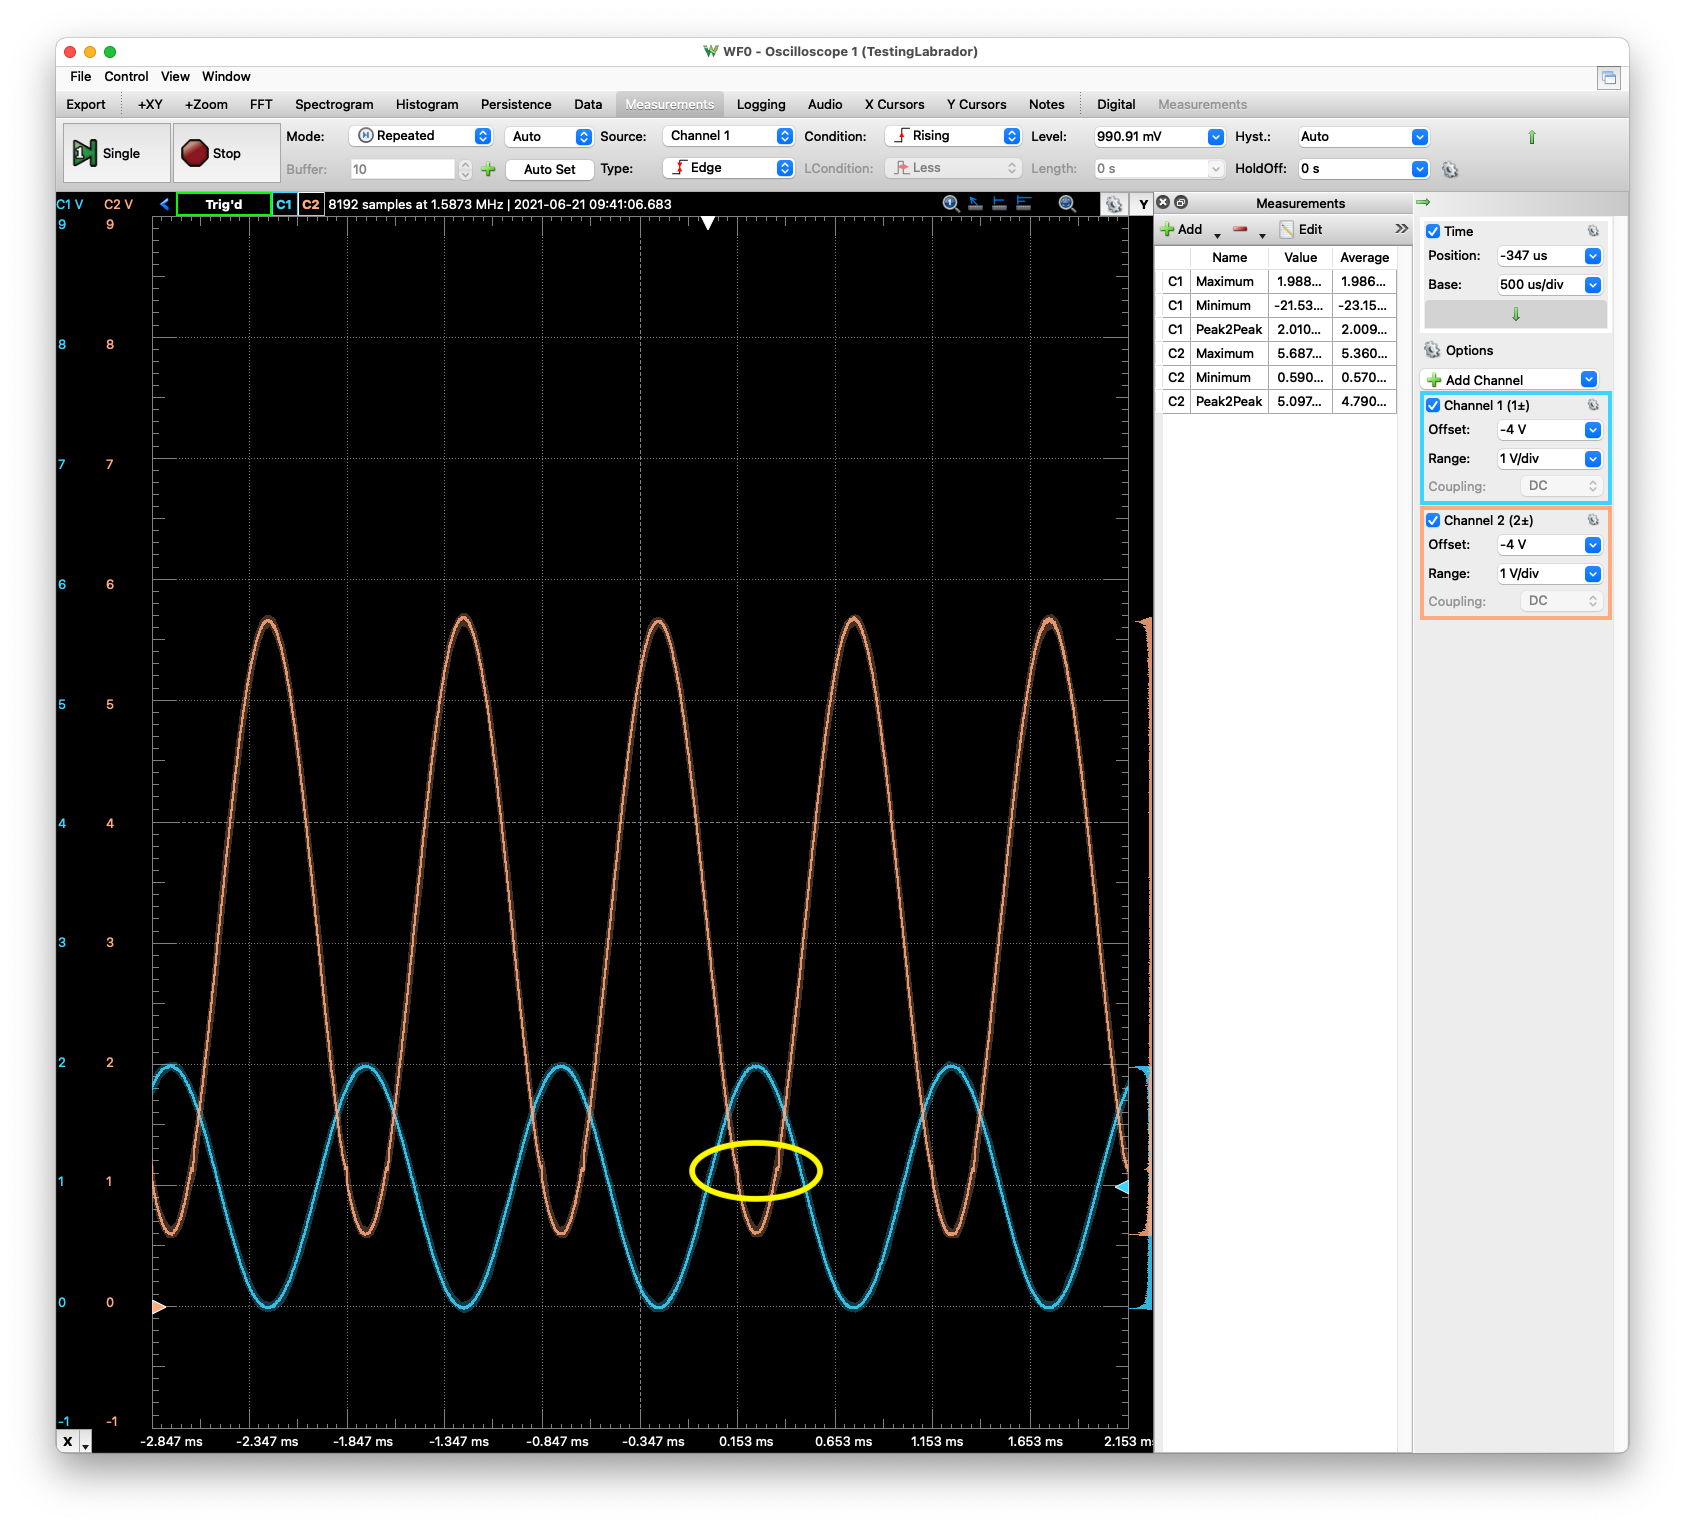
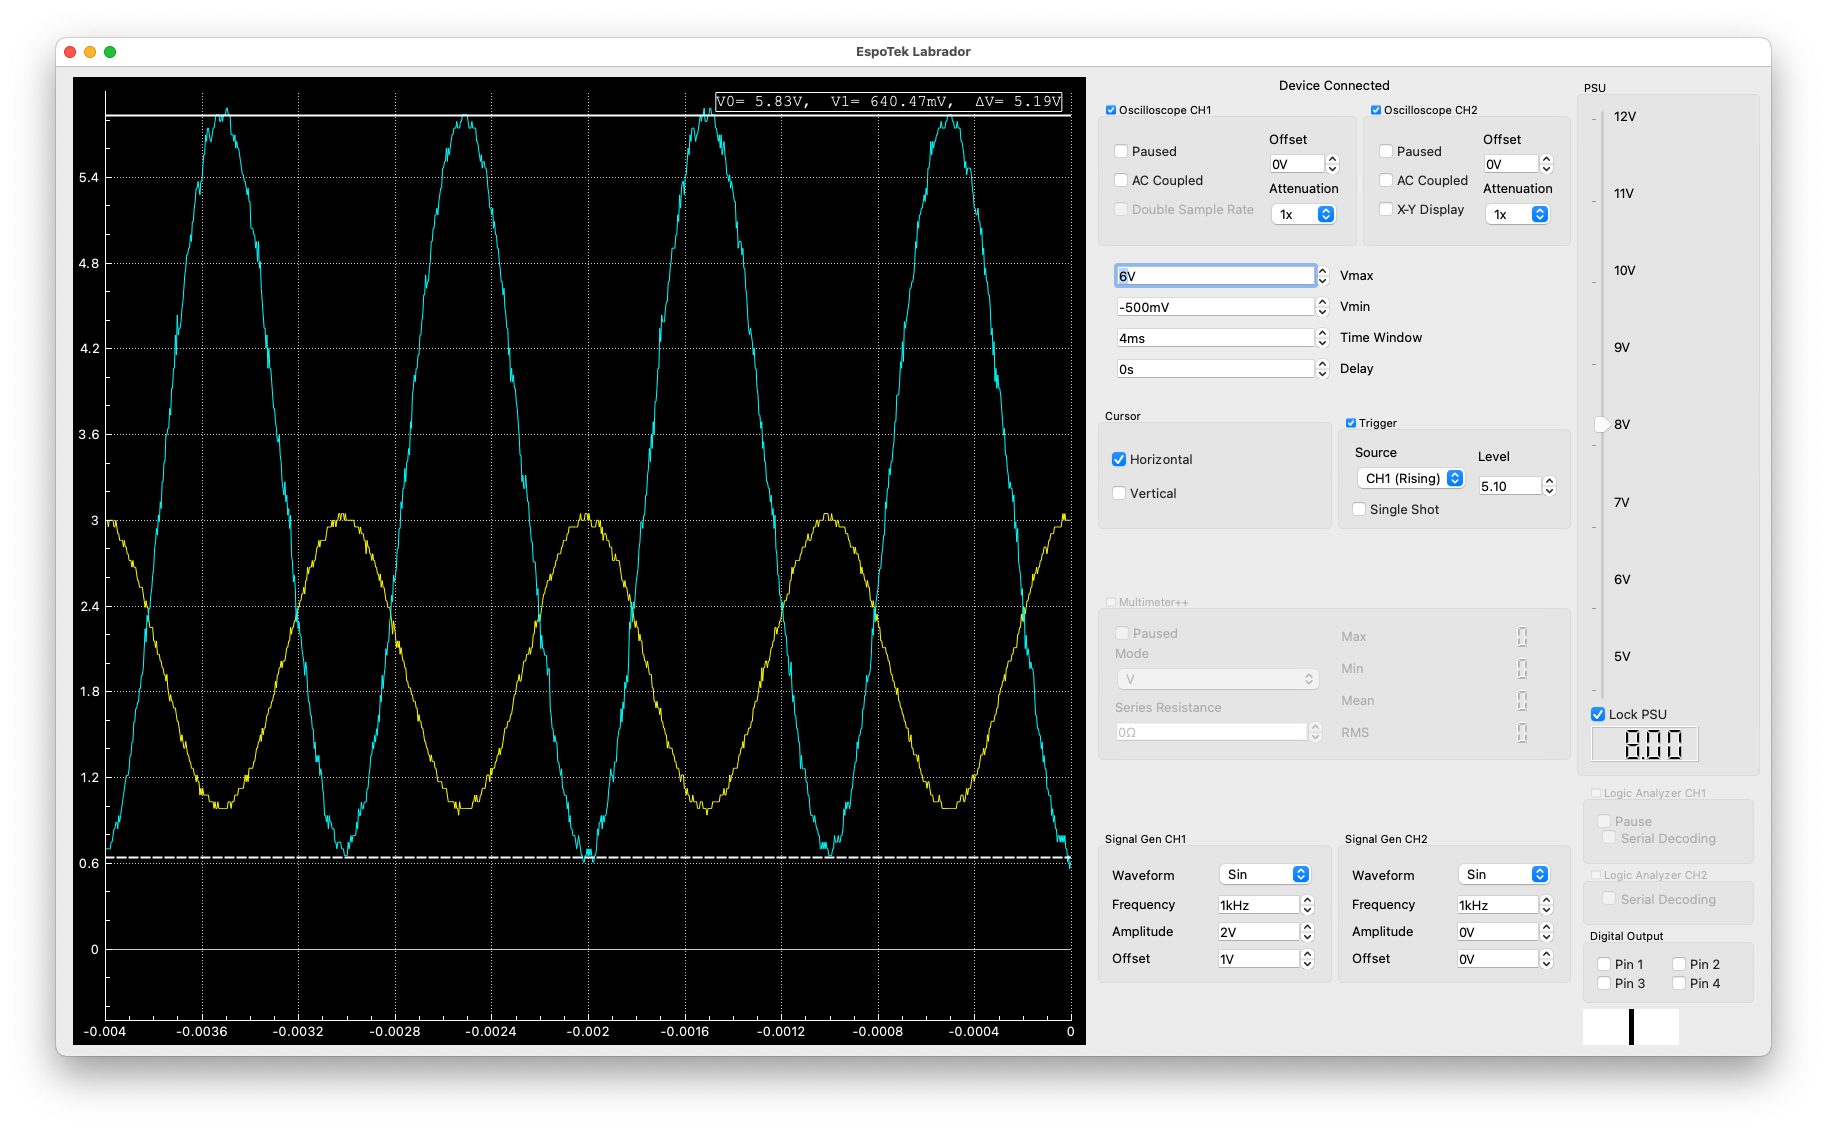
LM358-based inverting amplifier Time Domain Response measured using the Waveforms/AD2 (1.6V bias)
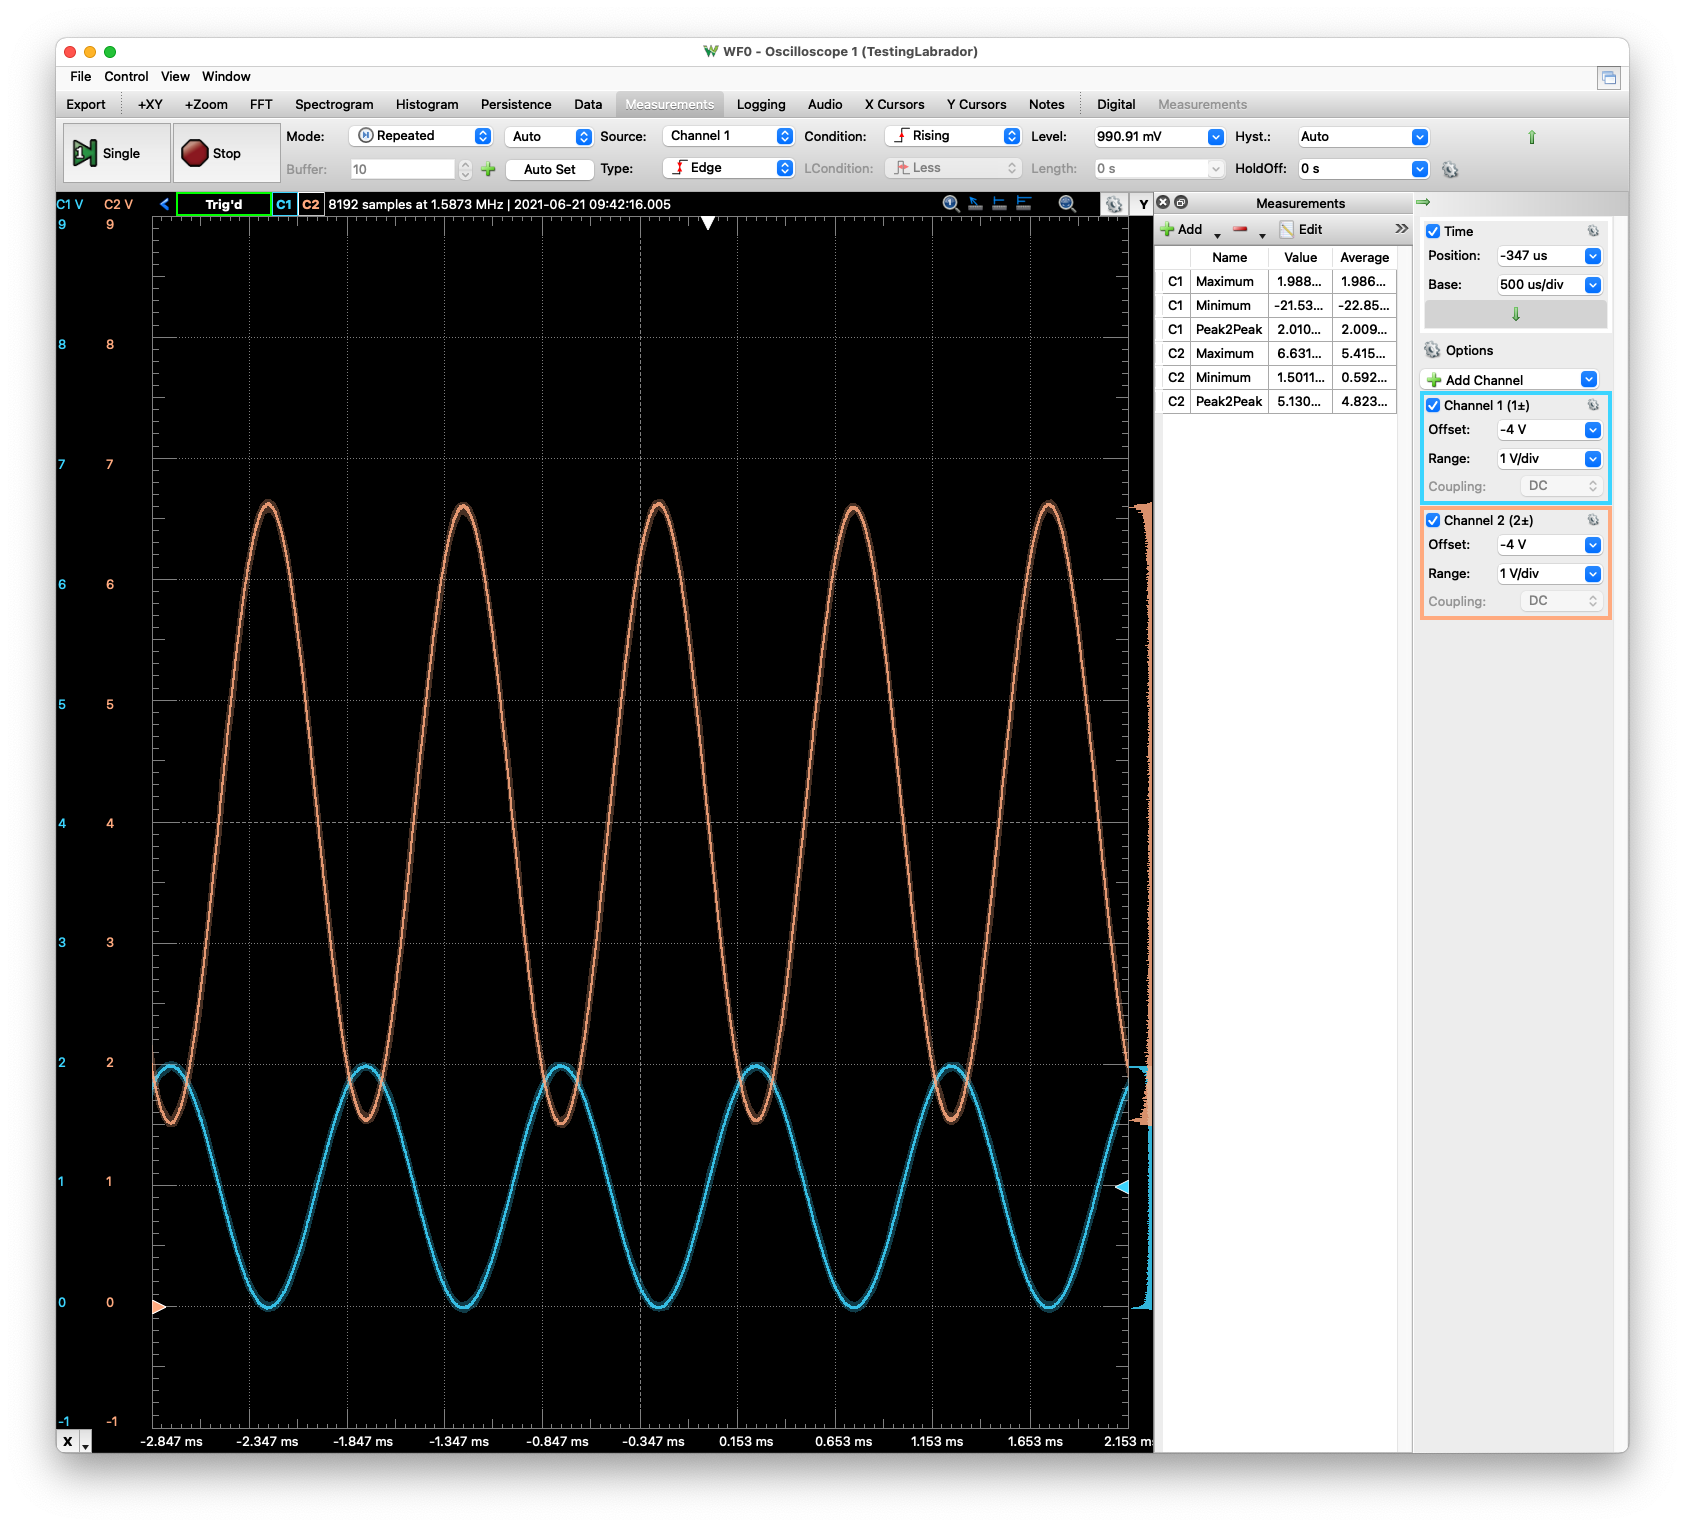
LM358-based inverting amplifier Time Domain Response measured using the Waveforms/AD2 (1.9V bias)
The answer to “does rail-to-rail” matter depends on the situation. As Collin points out in his answer to the LM358, the rail-to-rail operational amplifier he recommends the TLV2462 is 6x the cost of the LM358. If its cheaper and easier to raise the bias voltage (or other techniques, like raise the power supply voltage), the LM358 is fine. If one can’t raise the bais or power supply voltage, then it will be important to use a rail-to-rail op-amp such as the OP484 or TLV2462.
Possible Issue#
As I went back to using the LM358, I found an issue with the values reported by the Labrador vs. the AD2. The AD2 was able to represent the CircuitLab values faithfully, however the Labrador had significant issues.
CircuitLab Calculated Time Domain#
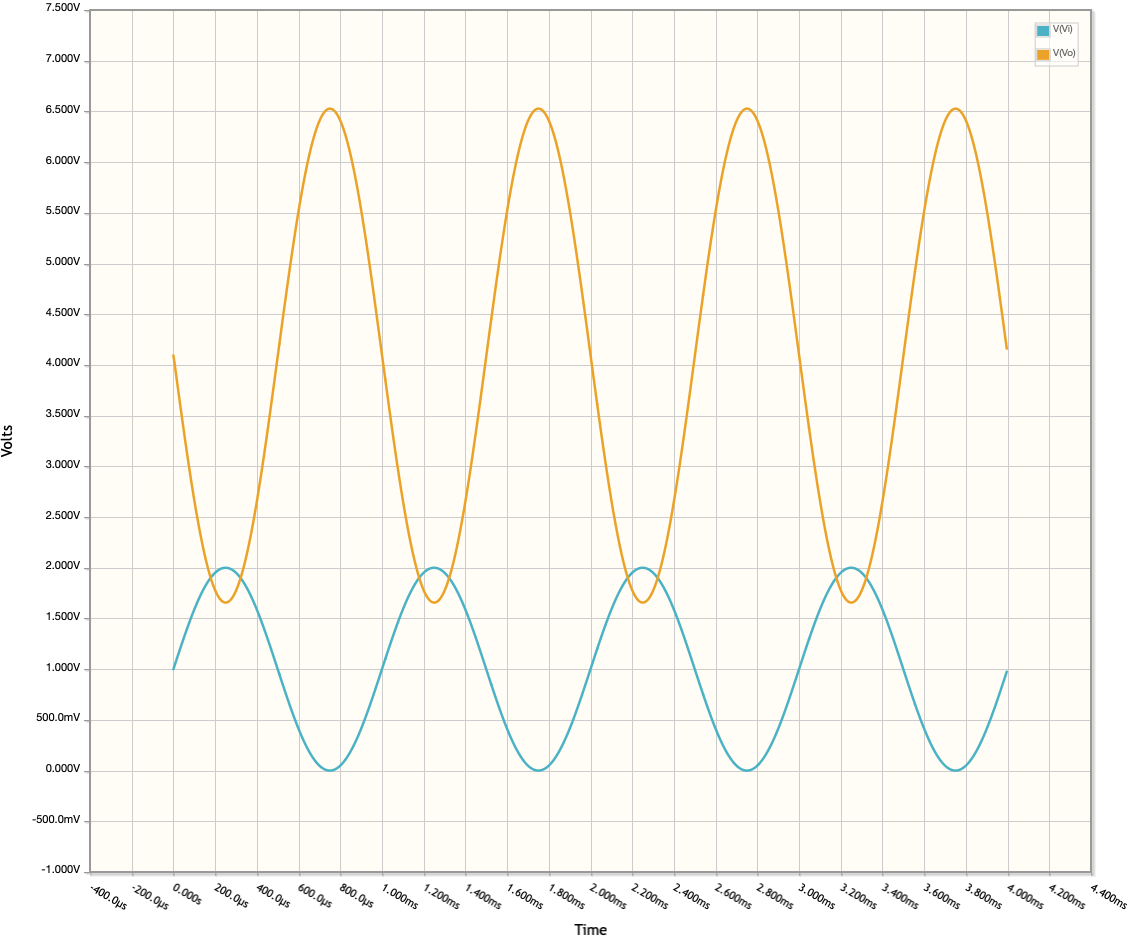
LM358-based inverting amplifier Time Domain Response calculated via CircuitLab(1.9V bias)
Analog Discovery 2 Measured Time Domain#
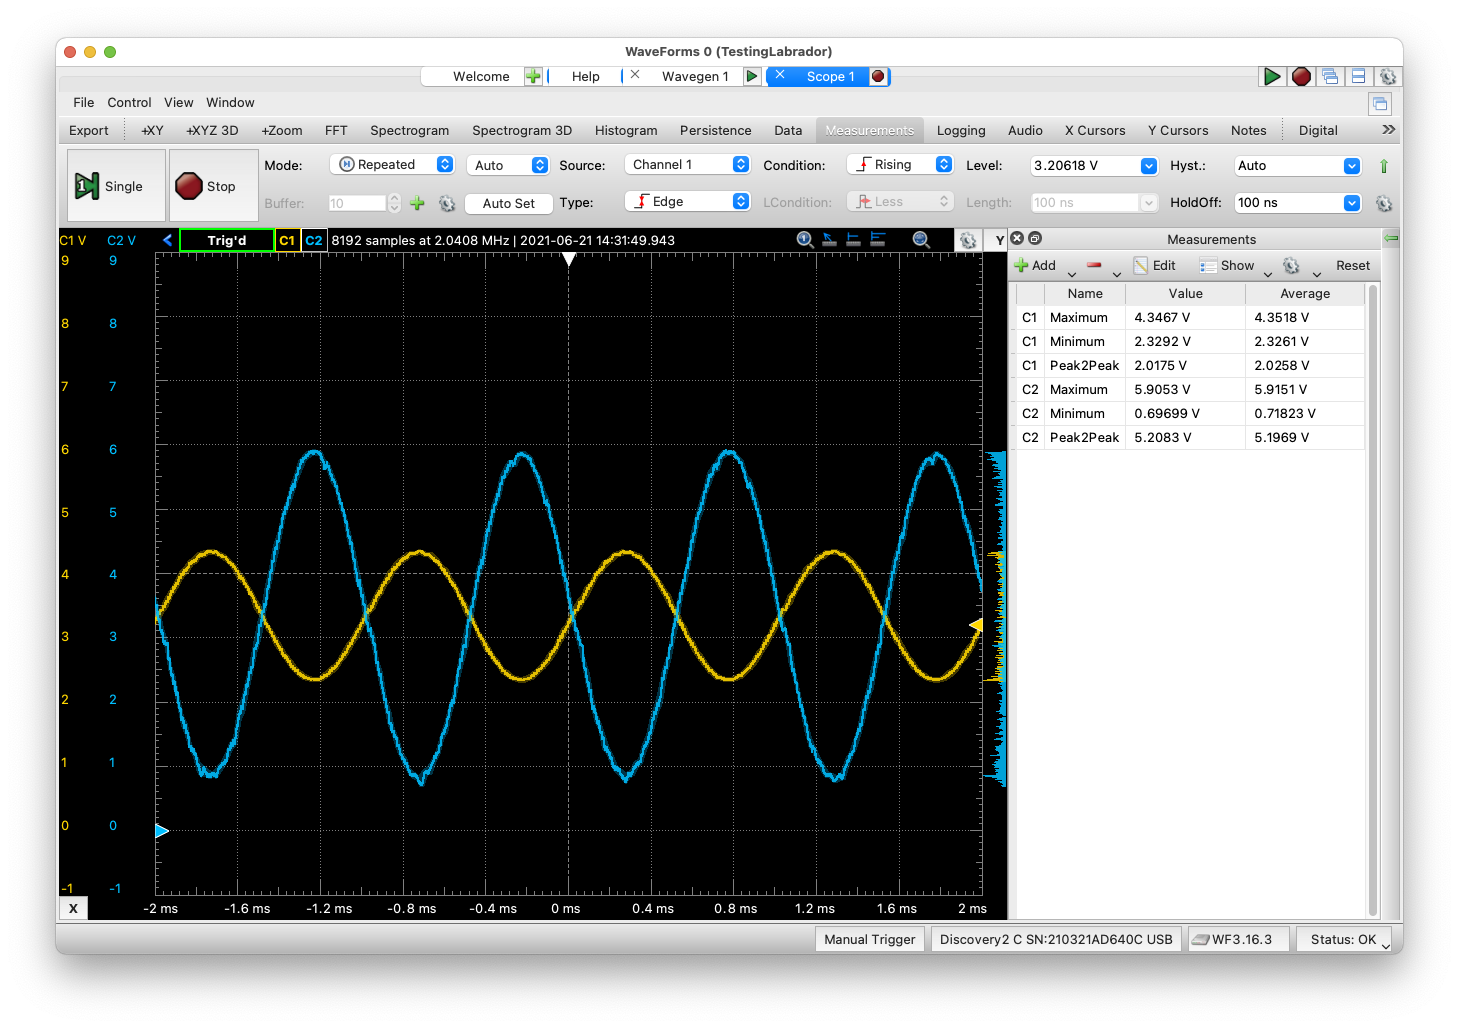
LM358-based inverting amplifier Time Domain Response measured using the Waveforms/AD2 (1.9V bias)
Labrador Measured Time Domain (1.9V bias)#
LM358-based inverting amplifier Time Domain Response measured using the Labrador (1.9V bias)
Labrador Measured Time Domain (2.4V bias)#
LM358-based inverting amplifier Time Domain Response measured using the Labrador (2.4V bias)
LM358-based inverting amplifier Time Domain Response measured using the Labrador (3.4V bias)
If I use a 3.4V bias with the Labrador, I’ll get the same values seen on the AD such as CH1 oscillates between Vmin=2.35V and Vmax=4.35V and CH2 oscillates between Vmin=0.7V and Vmax=5.9V. However, I still have a unexplained offset issue, where the CH1 values are significantly higher than theoretical (CircuitLab) or the AD2.
Net, net both devices have the same Oscilloscope values, its the Signal Generator of the Labrador which is impacted by the LM358. Or a better description is that it appears the amplifier driving the Signal Generator can’t go rail-to-rail, impacting the results.
A Resolution#
All is not lost! I took the approach Collin recommended in his video as to fixing the problem. He advised increasing the supply voltage. In my case, instead of increasing the supply voltage, I went to dual supplies adding a negative voltage supply of 9V. Here are the results:
Circuit in CircuitLab#
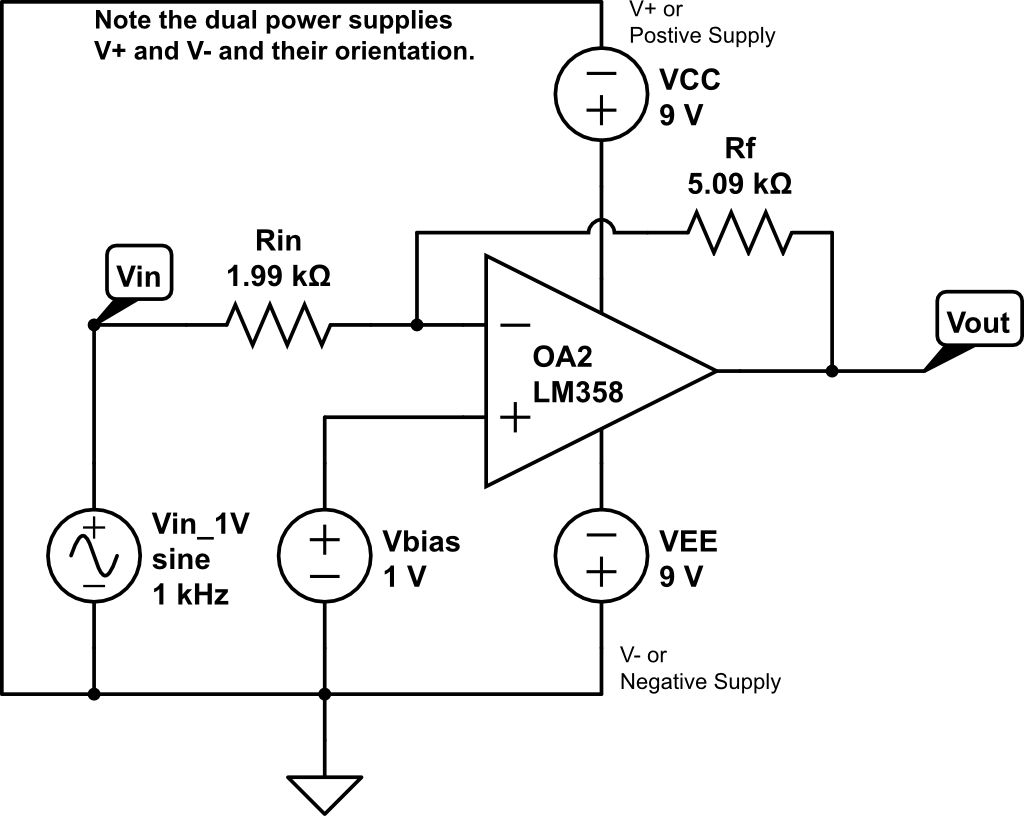
LM358-based inverting amplifier with dual supplies +/- 9V
CircuitLab Calculated Time Domain#
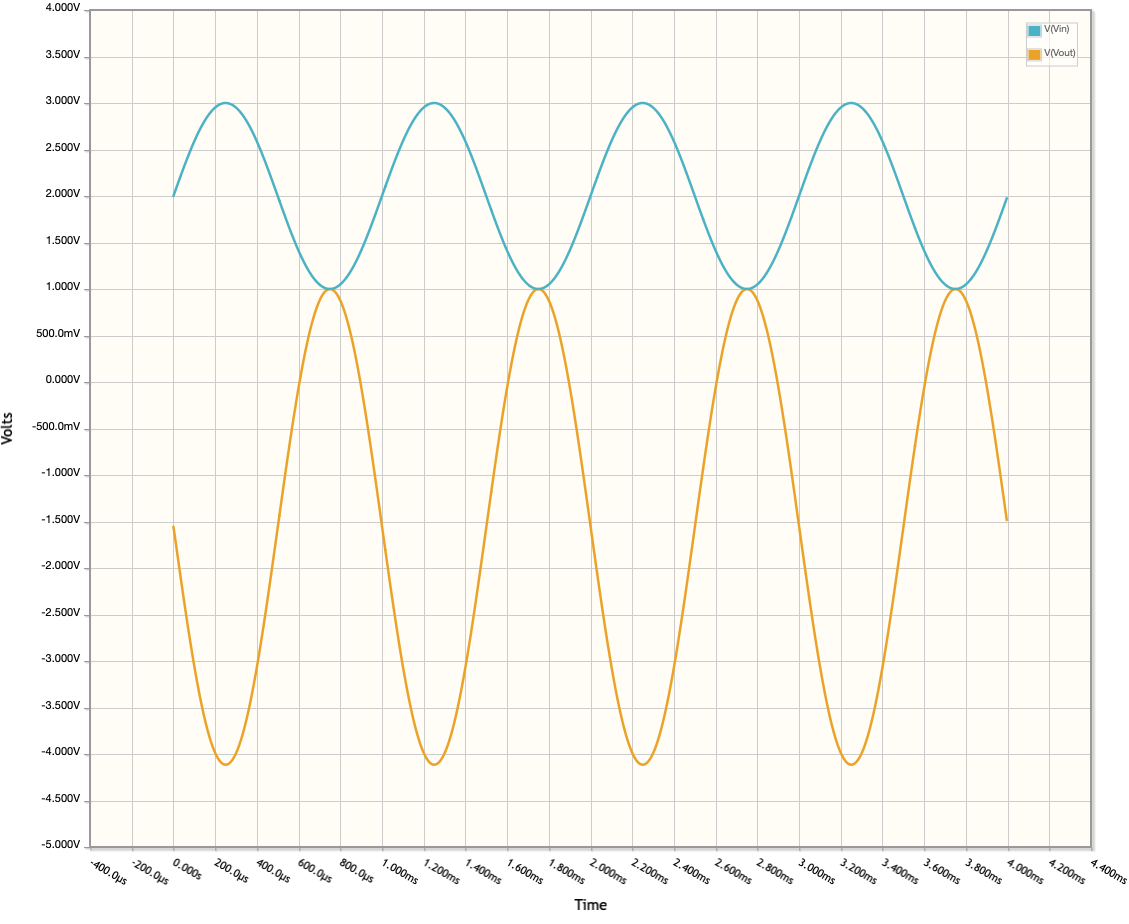
LM358-based inverting amplifier Time Domain Response from CircuitLab
Labrador Measured Time Domain#
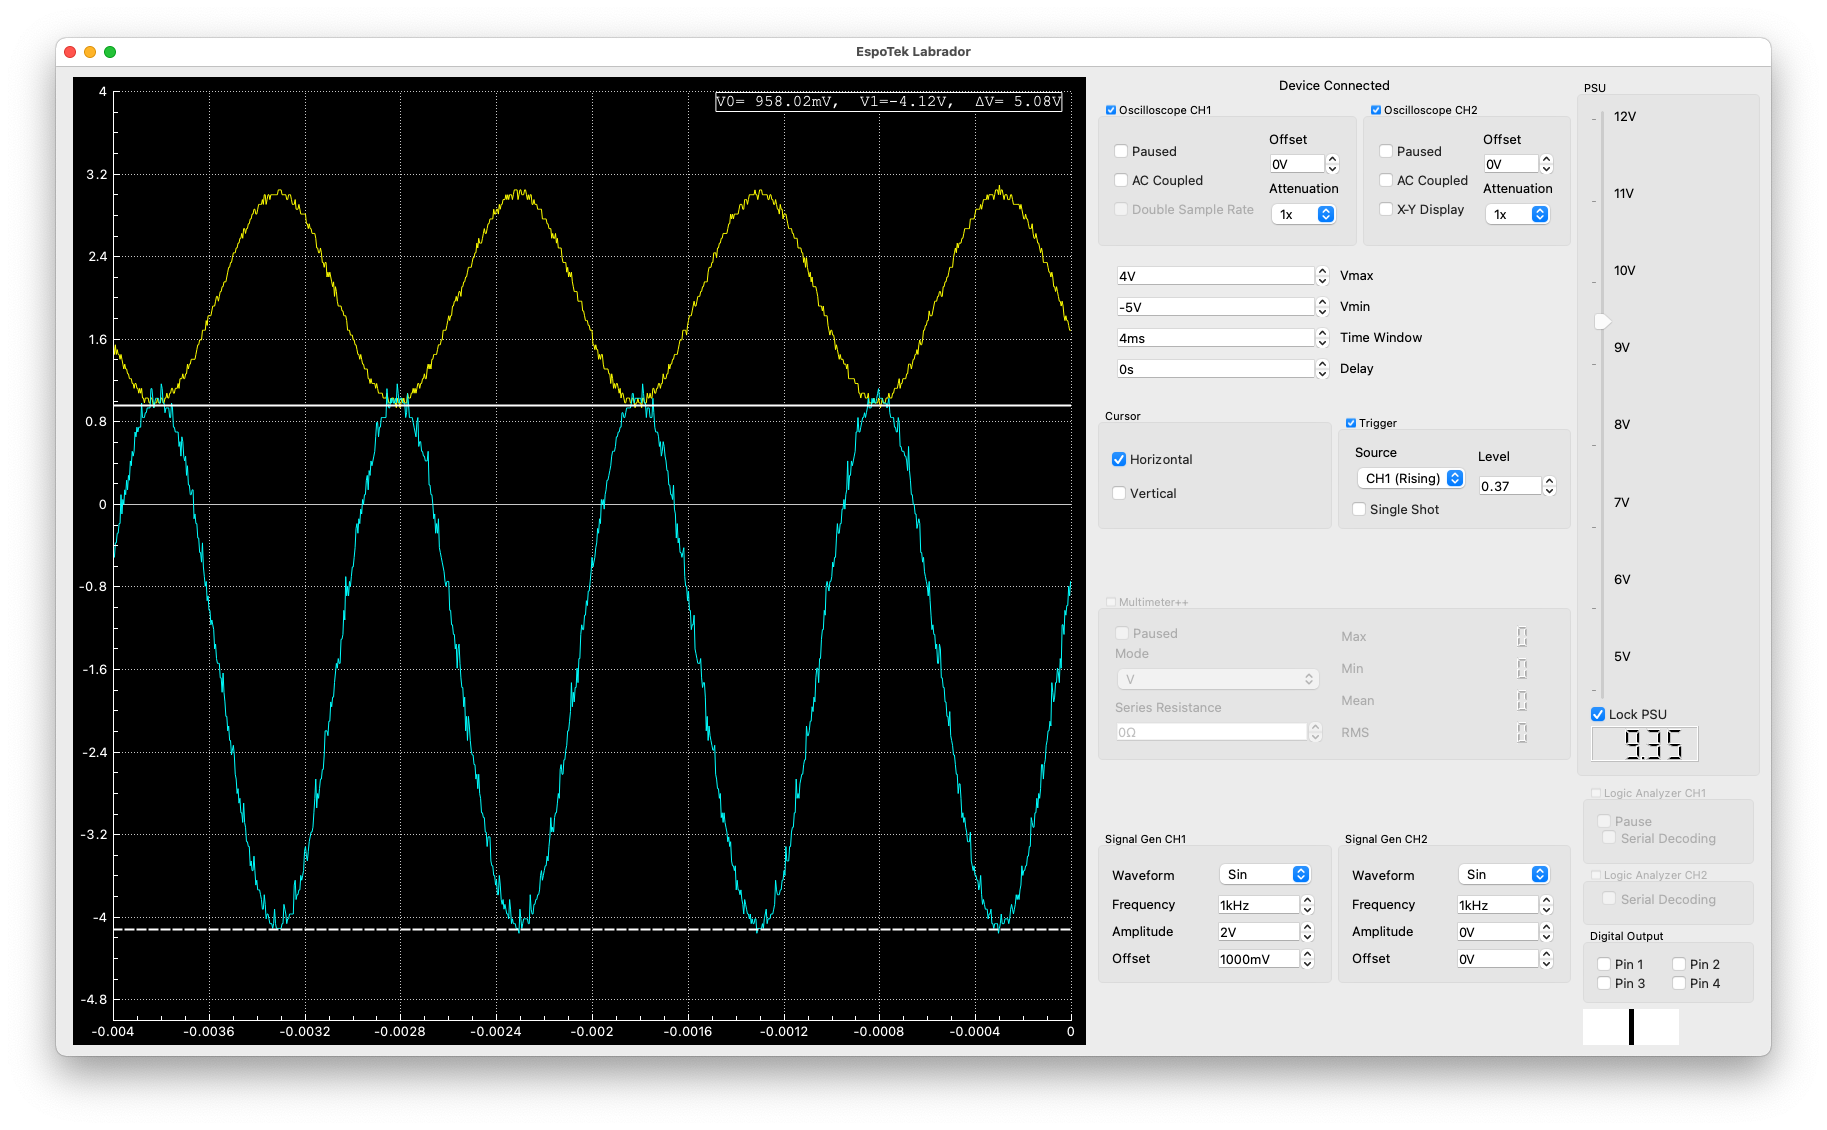
LM358-based inverting amplifier Time Domain Response measured using the Labrador
As I’ve said before, the Labrador offers great price/performance as a piece of test equipment. That said, it is only $30, which means in some situations, it will be important to separate the problems seen into 1) problem illustrated by the Labrador and 2) problem caused by the Labrador. Illustrated means the Labrador is showing me what I expect to see, while caused is the Labrador introduces an anomaly which I didn’t expect to see.
To compensate for this, we use modeling such as how I did with CircuitLab. I’m asking the question, what do I expect to see? If I don’t see what I modeled, I begin to breakdown the results confirming different parts.
Now that I know I might have a questionable Signal Generator on the Labrador, I can account for it by not operating it close to the rails or using a different one such as the online tone generator I used in analyzing Programmable Bias and Gain
Note:#
A word of caution, as I was setting up this lab, I had Vbias at 1.06V which drove Vout to range from 1.37 to -3.83, adding a 300mV offset to the output. It’s important to “dial-in” the approapriate bias with a potentiometer.